Diets

Facts
Increased Consumption
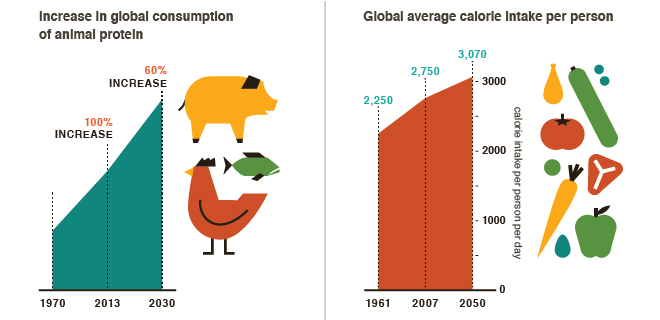
- Globally, food consumption has increased from 2,250 calories per person per day in 1961 to 2,750 calories per person per day in 2007, and is projected to increase to 3,070 calories per person per day by 2050 (Kastner et al. 2012; Alexandratos and Bruinsma 2012 p. 50).
- Despite increased consumption, South Asia and sub-Saharan Africa will continue to have the lowest daily food caloric intake per capita by 2050 (Alexandratos and Bruinsma 2012).
- People in South Asia will quadruple the amount of meat they consume from 2005 to 2050. Despite this increase, they will still consume only one-fifth as much meat as people in high-income nations (Alexandratos and Bruinsma 2012).
- The fastest increases in consumption per person between 1961 and 2007 were in cereals, followed by vegetable oils and livestock products. But in relative terms, consumption of vegetable oils, vegetables, fruits, livestock products, tea, coffee and cocoa increased more rapidly than cereals. Consumption of roots, tubers and pulses declined during the period (Kastner et al. 2012 p. 6868).
- Methods section: The historical analysis of food consumption uses data from the Food and Agriculture Organization of the United Nations (FAO) (FAOSTAT); see section on food demand for more details.
- Per capita consumption of roots and tubers will continue to decline everywhere except South Asia (Alexandratos and Bruinsma 2012).
- By 2050, per capita food consumption in Latin America, the Near East/North Africa and East Asia will be similar to that of high-income countries in 1990 (Alexandratos and Bruinsma 2012).
Meat and dairy demand
- Total global animal protein consumption has more than doubled since 1970. The growing global population and increasing per capita consumption of meat and dairy will increase global animal protein demand by 60% by 2030 (PBL 2009).
- Meat consumption in low- and middle-income countries (excluding China and Brazil) is projected to grow by 75% from 2005 to 2050, reaching 30 kg per person per year (Alexandratos and Bruinsma 2012).
- By 2050, Latin America’s per capita meat consumption (84 kg per person per year) will be on par with that of people in high-income countries (91 kg per person-1 per year-1) (Alexandratos and Bruinsma 2012).
- Globally, people consume an average of 39 kg of meat per person each year. North Americans consume 121 kg, Europeans (EU-15) consume 91 kg, Chinese consume 54 kg and Africans consume 14 kg (PBL 2009 p. 164).
- Producing food energy and protein from livestock takes 2.5–10 times as much energy as producing the same amount of food energy and protein from grain. Currently, one third of the world’s cereals supply is used for livestock feed, which results in lower energy efficiency (de Fraiture et al. 2007). If people could be persuaded to switch from eating livestock-based foods to cereals and vegetables—a difficult task—the energy efficiency of the global food system would be increased (Kahn and Hanjra 2009 p. 131).
- The production of animal protein must be more than tripled if the projected global population of 9 billion people in 2050 were to consume meat and dairy products at current North American and European levels (PBL 2009).
Sources and further reading
- Alexandratos N, Bruinsma J. 2012. World agriculture towards 2030/2050: The 2012 revision. ESA Working Paper No. 12-03. Rome: Food and Agriculture Organization of the United Nations. (Available from http://www.fao.org/docrep/016/ap106e/ap106e.pdf) (Accessed on 6 November 2013)
- de Fraiture C, Wichelns D, Rockström J, Kemp-Benedict E, Eriyagama N, Gordon LJ, Hanjra MA, Hoogeveen J, Huber-Lee A, Karlberg L. 2007. Looking ahead to 2050: scenarios of alternative investment approaches. In: Molden D, ed. Water for food, water for life: A comprehensive assessment of water management in agriculture. London: EarthScan and Colombo: International Water Management Institute. pp. 91–145. (Available from http://www.iwmi.cgiar.org/assessment/Water for Food Water for Life/Chapters/Chapter 3 Scenarios.pdf) (Accessed on 6 November 2013)
- Kastner T, Rivas M, Koch W, Nonhebel S. 2012. Global changes in diets and the consequences for land requirements for food. PNAS 109(18):6868–6872. (Available from www.pnas.org/cgi/doi/10.1073/pnas.1117054109) (Accessed on 6 November 2013)
- Khan S, Hanjra, MA. 2009. Footprints of water and energy inputs in food production – global perspectives. Food Policy 34:130–140. (Available from http://dx.doi.org/10.1016/j.foodpol.2008.09.001) (Accessed on 6 November 2013)
- [PBL] Planbureau voor de Leefomgeving. 2009. Milieubalans 2009. Bilthoven, The Netherlands: Planbureau voor de Leefomgeving. (Available from http://www.pbl.nl/nl/publicaties/2009/milieubalans/) (Accessed on 6 November 2013)