Direct Agricultural Emissions

Facts
Emissions from Agricultural Soils (N2O)
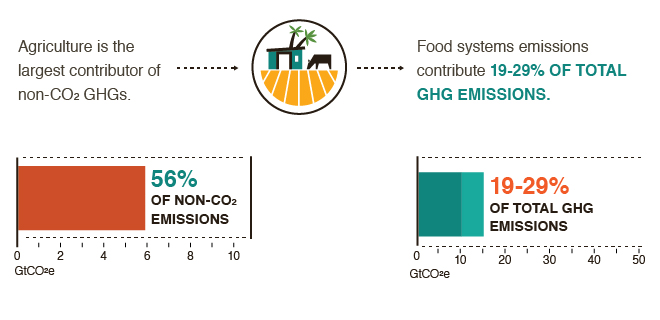
- Between 1990 and 2012, nitrous oxide (N2O) emissions from agricultural soils increased by 30.9%, from 1,614 million tonnes of carbon dioxide (CO2) equivalent to 2,114 million tonnes, which corresponds to 39.3% of total agricultural emissions (FAO 2015)
- Underlying this trend are increases in crop production and fertilizer use and other nitrogen sources such as crop residues (US-EPA 2012)
- From 2012 to 2030, N2O emissions from agricultural soils are projected to increase by 3.8%, from 2,114 million tonnes of CO2 equivalent to 2,195 million tonnes, which corresponds to 38.1% of total agricultural emissions (FAO 2015)
Emissions from Livestock and Animal Products
- The livestock sector contributes an estimated 7,100 million tonnes of CO2 equivalent per year, representing 14.5% of human-induced greenhouse gas emissions (Gerber et al. 2013).
- Production of beef and cattle milk accounts for the majority of emissions, contributing 41% and 20%, respectively, of the sector’s emissions. Production of pig meat and poultry meat and eggs contribute 9% and 8%, respectively, of the sector’s emissions (Gerber et al. 2013).
- Feed production and processing, and enteric fermentation from ruminants are the two main sources of emissions, accounting for 45% and 39%, respectively, of sector emissions. Manure storage and processing account for 10 % of emissions (Gerber et al. 2013).
- The consumption of fossil fuel along livestock-sector supply chains accounts for about 20% of sector emissions (Gerber et al. 2013).
- About 44% of the sector’s emissions are in the form of methane (CH4). The rest is almost equally shared between N2O (29%) and CO2 (27%) (Gerber et al. 2013).
- Global CH4 emissions from enteric fermentation increased by 11.2% from 1990 to 2012, from 1,869 million tonnes of CO2 equivalent to 2,080 million tonnes, a share that represents 38.7% of total agricultural emissions in 2012 (FAO 2015)
- From 2012 to 2030, CH4 emissions from enteric fermentation are projected to increase by 13.7%, from 2,080 million tonnes of CO2 equivalent to 2,365 million tonnes (FAO 2015).
- From 1990 to 2012, CH4 and N2O emissions from manure management increased by 8.7%, from 335 million tonnes of CO2 equivalent to 364 million tonnes, corresponding to 6.8% of total agricultural emissions in 2010 (FAO 2015)
- From 2012 to 2030, global CH4 and N2O emissions from manure management are projected to increase by 13.4%, from 364 million tonnes of CO2 equivalent to 413 million tonnes (FAO 2015).
- Before the beginning of the second bullet point (Production of beef and cattle milk…) include: “Cattle production accounts for 64 to 78% of livestock emissions (Herrero et al. 2016).
- Land use and land-use changes for feed production and pastures are also one of the most representative sources of emissions, accounting for approximately 1.6 GtCO2eq per year (Gerber et al. 2013)
Emissions from Rice Cultivation (CH4)
- CH4 emissions from rice production have increased 12% from 1990 to 2012, from 466 million tonnes of CO2 equivalent to 522 million tonnes, corresponding to approximately 9.7% of total agricultural emissions in 2012. Underlying this trend has been a similar increase in the land area of harvested rice (FAO 2015)
- From 2012 to 2030, CH4 emissions from this source are projected to decrease 3.8% from 522 million tonnes of CO2 equivalent to 502 million tonnes (FAO 2015)
Other Agriculture Sources of non-CO2 Emissions (CH4, N2O):
- From 1990 to 2012, total emissions from other agricultural sources (such as burning of crop residues) increased from 277 million tonnes of CO2 equivalent to 301 million tonnes, corresponding to approximately 5.6% of total agricultural emissions in 2010 (FAO 2015).
| Type of emission | Total emissions 1990 (MtCO2e) | Total emissions 2012 (MtCO2e) | Total emissions 2030 (projection) (MtCO2e) |
|---|---|---|---|
| (million tonnes of CO2 equivalent) | |||
| Agricultural soils (N2O) | 1,614 (35.4%) | 2,114 (39.3%) | 2,195 (38.1%) |
| Enteric fermentation (CH4) | 1,869 (41%) | 2,080 (38.7%) | 2,365 (41.1%) |
| Rice cultivation (CH4) | 466 (10.2%) | 522 (9.7%) | 502 (8.7%) |
| Manure management (CH4, N2O) | 335 (7.3%) | 364 (6.8%) | 413 (7.2%) |
| Other emissions (CH4, N2O) | 277 (6.1%) | 301 (5.6%) | 281 (4.9%) |
| Total non-CO2 emissions | 4,561 (100%) | 5,381 (100%) | 5,756 (100%) |
Sources and further reading
- Herrero M, Henderson B, Havlik P, Thornton PK, Conant RT, Smith P, Wirsenius S, Hristov AN, Gerber P, Gill M, Buttebach-Bahl, Valin H, Garnett T, Stehfest E. 2016. Greenhouse gas mitigation potentials in the livestock sector. Nature Climate Change 6:452-461. http://dx.doi.org/10.1038/nclimate2925
- Gerber PJ, Steinfeld H, Henderson B, Mottet A, Opio C, Dijkman J, Falcucci A, Tempio G. Tackling Climate change through livestock: a global assessment of emissions ad mitigation opportunities. Rome: FAO.
- FAO. 2015. Food and Agriculture Organization of the United Nations, FAOSTAT database. Available at: http://faostat3.fao.org/faostat-gateway/go/to/home/
- Gerber PJ, Steinfeld H, Henderson B, Mottet A, Opio C, Dijkman J, Falcucci A, Tempio G. 2013. Tackling climate change through livestock – A global assessment of emissions and mitigation opportunities. Rome: Food and Agriculture Organization of the United Nations. (Available from http://www.fao.org/docrep/018/i3437e/i3437e.pdf) (Accessed on 6 November 2013)
- [US-EPA] United States Environmental Protection Agency. 2012. Global anthropogenic non-CO2 greenhouse gas emissions: 1990 – 2030. EPA 430-R-12-006. Washington, DC: US-EPA. (Available from http://www.epa.gov/climatechange/EPAactivities/economics/nonco2projections.html) (Accessed on 6 November 2013)