Supply Chain Emissions

Facts
- Food production and consumption contribute 19–29% of all anthropogenic greenhouse gas emissions—a total of 9,800–16,900 million tonnes of carbon dioxide (CO2) equivalent at 2008 levels each year. This figure includes the full supply chain, including fertilizer manufacture, agriculture, processing, transport, retail, household food management and waste disposal (Vermeulen et al. 2012).
- Agriculture makes the greatest contribution to total food system emissions—7,300–12,700 million tonnes of CO2 equivalent each year, equivalent to 80–86% of food systems emissions and 14–24% of total global emissions (Vermeulen et al. 2012).
- Deforestation and land use change account for 2,200–6,600 million tonnes of CO2 equivalent per year. This is 30–50% of agricultural emissions and 4–14% of total global emissions (Vermeulen et al. 2012, based on van der Werf et al. 2010 and Blaser and Robledo 2007).
- Direct emissions from agriculture through, for example, such activities as managing soils, crops and livestock total 5,100–6,100 million tonnes of CO2 equivalent per year—50–70% of agricultural emissions and 10–12% of total global emissions (US-EPA 2012).
- Significant and consistent reductions are observed in the GHG intensity of both livestock and crop production. However, if further mitigation measures and technical efficiency improvements fail to be implemented, future emissions may further increase by up to 30% by 2050.
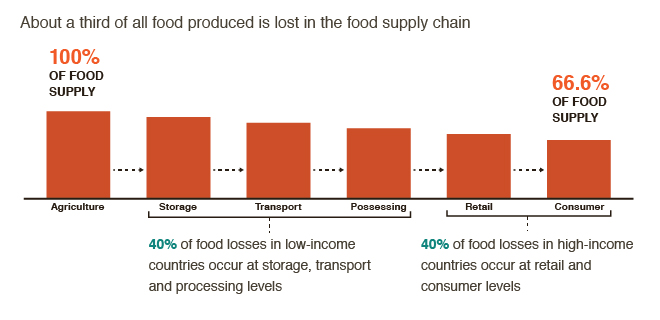
- The proportion of emissions from sections of the food chain after food leaves the farm is larger in high-income countries than in lower-income countries. For example, these activities make up some 50% of food system emissions in the United Kingdom (Garnett 2011). Middle-income countries will likely follow this trend in the future.
- Fisheries and aquaculture make only minor contributions to greenhouse gas emissions, but are linked to other environmental impacts.
Sources and further reading
- Blaser J, Robledo C. 2007. Initial analysis on the mitigation potential in the forestry sector. Bern: Intercooperation. (Available from https://unfccc.int/files/cooperation_and_support/financial_mechanism/application/pdf/blaser.pdf) (Accessed on 6 November 2013)
- Garnett T. 2011. Where are the best opportunities for reducing greenhouse gas emissions in the food system (including the food chain)? Food Policy 36:23–32. (Available from http://dx.doi.org/10.1016/j.foodpol.2010.10.010)
- [US-EPA] United States Environmental Protection Agency. 2012. Global anthropogenic non-CO2 greenhouse gas emissions: 1990 – 2030. EPA 430-R-12-006. Washington, DC: US-EPA. (Available from http://www.epa.gov/climatechange/EPAactivities/economics/nonco2projections.html) (Accessed on 6 November 2013)
- van der Werf GR, Morton DC, DeFries RS, Olivier JGJ, Kasibhatla PS, Jackson RB, Collatz GJ, Randerson JT. 2009. CO2 emissions from forest loss. Nature Geoscience 2:737–38. (Available from http://152.3.12.176/jackson/ng09.pdf) (Accessed on 6 November 2013)
- Vermeulen SJ, Campbell BM, Ingram J SI. 2012. Climate change and food systems. Annual Review of Environmental Resources 37:195–222. (Available from http://www.annualreviews.org/doi/abs/10.1146/annurev-environ-020411-130608) (Accessed on 6 November 2013)