Abr 2, 2014
3 Graphics To Explain The Present And Future Of Climate Change - Forbes.com
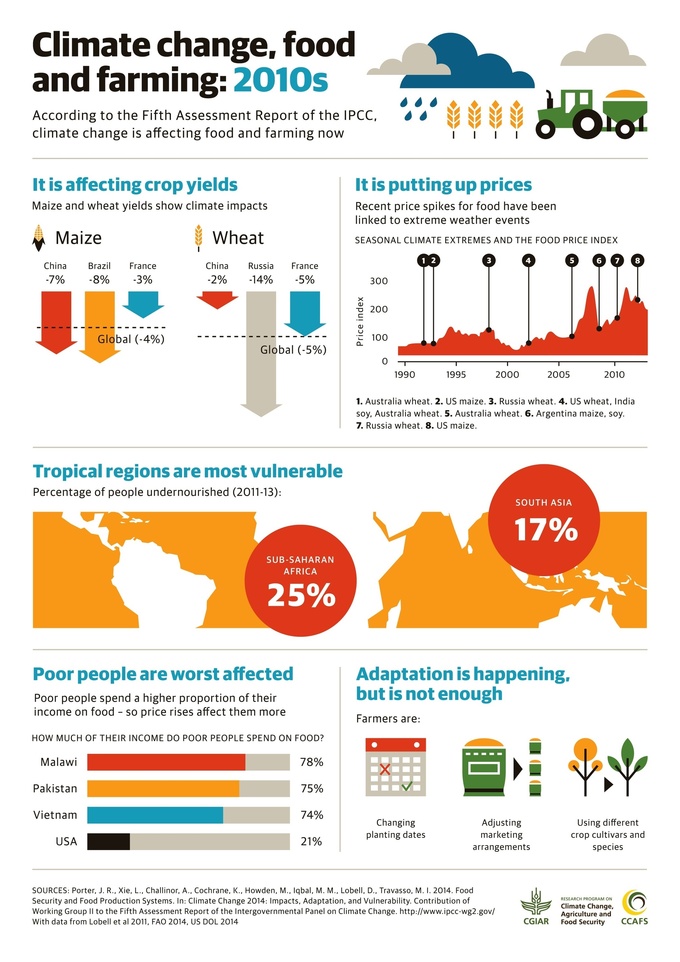
The graphics, created by the Climate Change, Agriculture and Food Security Group, explain the state of agriculture at a different point in time - the first at how climate change is impacting the world today, then at the predictions for 2030 and 2050.
CGIAR Climate's insight:
To help translate the IPCC’s 30 chapter report released today, the CGIAR Research Program on Climate Change, Agriculture and Food (CCAFS) created three infographics. Each looks at the state of agriculture at a different point in time – the first at how climate change is impacting the world today, then at the predictions for 2030 and 2050.