Better data on tropical greenhouse gas emissions hotspots from land use sector now available

Scientists published detailed land sector gross emissions data and corresponding uncertainties for the tropics, enabling better estimates of mitigation potential and data-driven decision-making needed to meet the Paris Agreement goals.
According to the most recent Intergovernmental Panel on Climate Change (IPCC) Assessment Report, global greenhouse gas emissions must be cut by 41-72% below 2010 levels by 2050 in order to have a likely chance of limiting the increase in global mean temperature to 2°C. This requires unprecedented changes in all the emission sectors, particularly in energy systems and improved land use management practices.
The land sector accounts for about a quarter of net anthropogenic GHG emissions, mainly from deforestation, agricultural emissions from soil management practices, and livestock. Likewise, the land sector is key in global mitigation strategies, as it can potentially contribute 20-60% of cumulative abatement to 2030.
Not surprisingly, the Paris Agreement endorses emissions mitigation in the land sector and long-term storage in biogenic carbon as necessary means to achieve greenhouse gas neutral economies in the second half of this century. Countries have readily included the land sector as a fundamental pillar of their mitigation commitments through their Intended Nationally Determined Contributions (INDCs) and NDCs. Tracking progress toward these commitments requires shared understanding of mitigation potentials, trust in data and associated uncertainties, and implementation assistance at local, national, and landscape scales.
In spite of the importance of the land use sector, emissions from land activities still hold the largest uncertainties of all the emission sectors, and data comparability among countries and regions are jeopardized by methodological and definition inconsistencies.
There was a need, therefore, to produce a consistent dataset with land emissions and associated uncertainties for key greenhouse gases (CO2, CH4, N2O and CO2e) that allowed country comparability, offered new data for countries with limited capacities, and approached the topic of uncertainties in a consistent and robust manner.
Our research, published in Biogeosciences, contains a spatially detailed benchmark for monitoring progress on reducing emissions, including locations of hotspots of emissions in order to assist national policy makers, investors and other decision-makers who seek to understand the mitigation potential of the land-use sector.
In collaboration with CCAFS low emissions agriculture research and led by the Center for International Forestry Research (CIFOR), Wageningen University and Research Centre (WUR), and Karlsruhe Institute of Technology (KIT), we have produced novel datasets on land emissions and uncertainties (see Figure 1 below) and leading emission sources (Figure 2 below) in a spatially explicit manner (0.5°) for the tropics and subtropics - where data are more scarce and more uncertain - for the period 2000-2005. These datasets are available here and the methodological details are described in our paper published in Biogeosciences.
Need for information that countries and policy makers can use
Datasets can be useful to a diversity of stakeholders.
- Countries’ technical teams need to know: Where are the hotspots of land emissions? What are the main emission sources (i.e. forests, agriculture or livestock-related) behind these hotspots? What are the uncertainties of these emissions, and do we need new methods and approaches to improve data certainty?
- Policy-makers and decision-makers need the data to prioritize mitigation actions. They need to know where to act and on which emission sources to act first.
- UNFCCC experts and reviewers will benefit from the comparability of the datasets produced, including documented methods and limitations, which can be used in the review/revision process of countries' NDCs and national greenhouse inventories mandated by the UNFCCC.
- Climate finance organizations and international donors will be able to use spatially explicit and comparable uncertainty maps to prioritize areas where mitigation potentials are high (high emissions) and uncertainties are low, as a way to increase mitigation effectiveness. (It is understood that climate finance and donor decisions should and will also address social and ecological benefits.)
What the data say
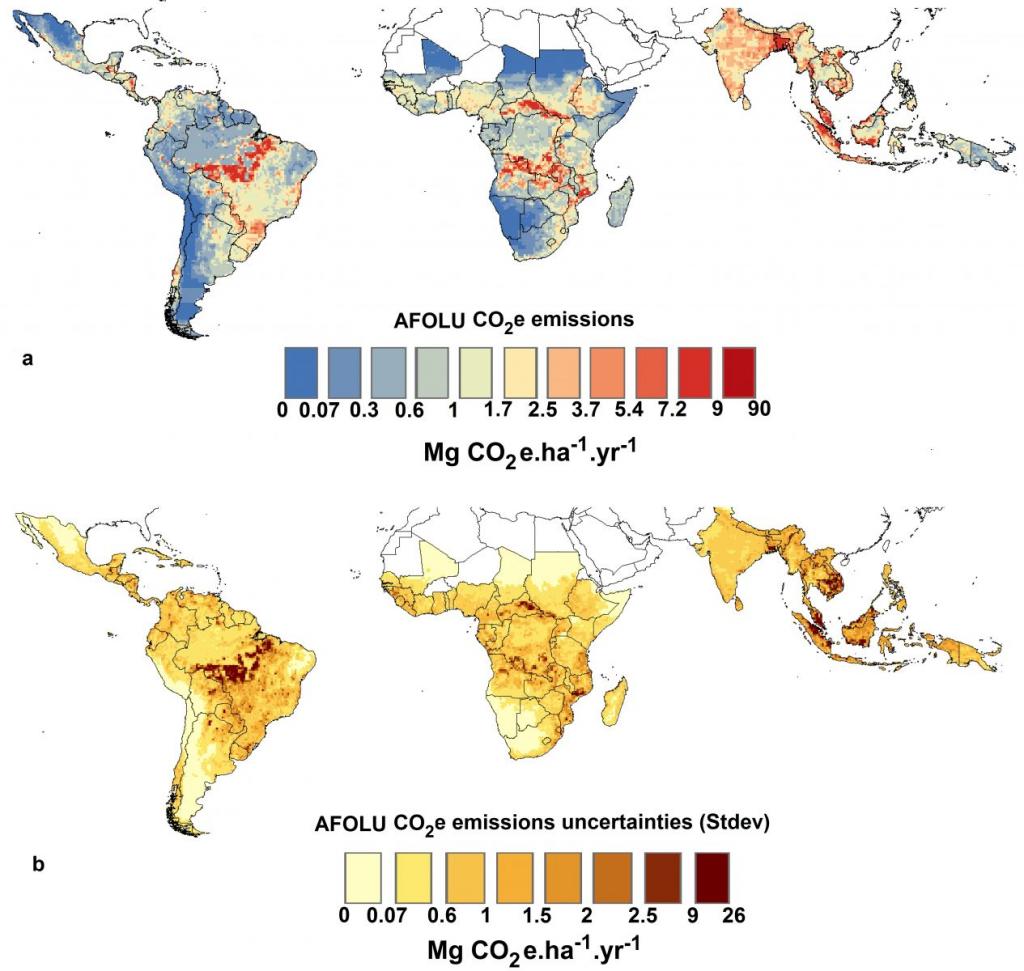
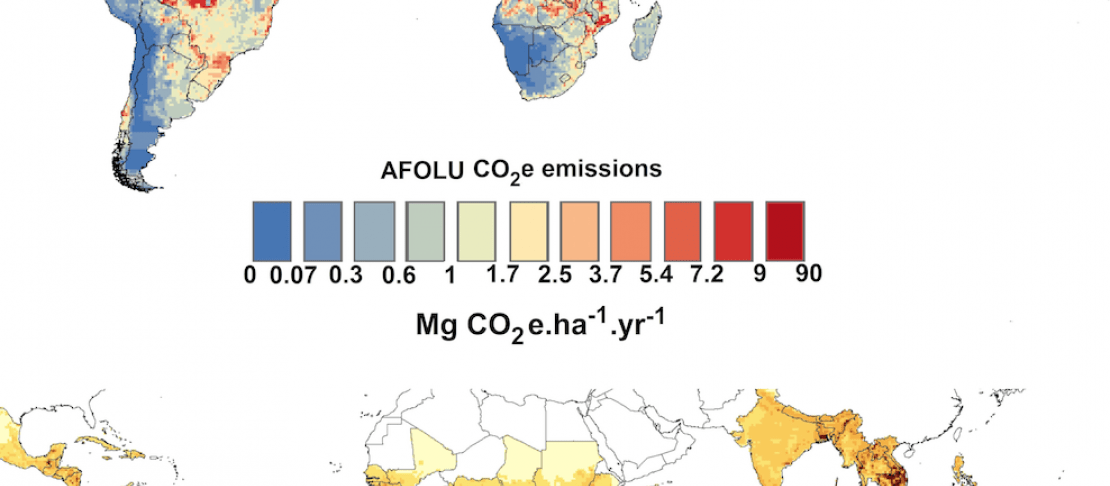
Figure 1. a) Hotspots of annual AFOLU emissions (red cells) and (b) associated uncertainties for the tropical region for the period 2000-2005, at 0.5°resolution.
Emissions are the result of leading land sector emission sources (deforestation, degradation (fire, wood harvesting), soils (crops, paddy rice), livestock (enteric fermentation and manure management).
Source: Roman-Cuesta et al. (2016)
As shown Figure 1, there are land sector emissions hotspots on all continents. Particularly important areas are evergreen rainforest deforestation in Central and South America, fire in dry forests in Africa, and both peatland and agricultural emissions in Asia.
Higher emissions from forests coincide with higher uncertainties, highlighting the importance of agricultural hotspots as mitigation targets since their uncertainties are smaller and, therefore, could result in more effective mitigation action. Taking into account forests' technical and economic potentials and social and ecological services, however, render forests a continuing priority for mitigation.
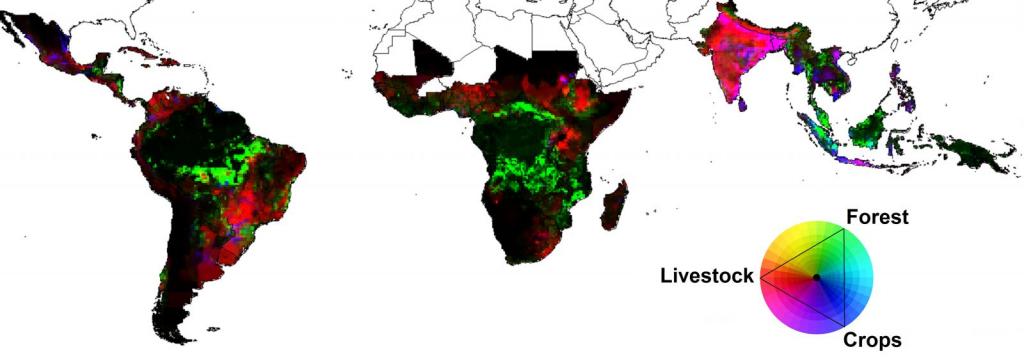
Figure 2. Contribution of the leading emission sources in percent of total emissions (grouped into forests, crops and livestock) to the per pixel (0.5°), for 2000-2005. Forest emissions include fire, deforestation and wood harvesting. Crop emissions include paddy rice, cropland soil and croplands over drained histosols. Livestock emissions include enteric fermentation and manure management emissions.
This figure is an RGB image where final colours represent the strength of the emissions for the three sources (e,g, fuchsia colours in Asia represent equal emissions from livestock (red) and crops (blue). Dark represents areas of low emissions.
Source: Roman-Cuesta et al. (2016)
Figure 2 helps decision-makers prioritize which emission sources to target first for mitigation actions. In general terms, forests are the predominant source of land emissions in the tropics (75% of the total CO2e land sector budget, and 69% for CO2 specifically) due to deforestation and forest degradation (considered as fire and wood harvesting in forests). Deforestation and forest degredation are shown as the green colours in Figure 2; they include the arch of deforestation in Brazil, the Miombo dry woodlands in Africa, and palm oil expansion and peat fires in Indonesia and Malaysia.
Certain regions are led by livestock emissions, shown in the red colors in Figure 2, incluing the sub-Saharan and upper tropical belt in Africa. Equal contributions of livestock and cropland emissions are represented by the pink colours, including southeastern Brazil, northern Argentina, India, and hotspots in Indonesia and Viet Nam.
Decision-makers in Asia will note that hotspots of cropland emissions in Asia, particularly paddy rice - shown in blue colous in Figure 2 - should also be targeted in mitigation action.
Non-CO2 agricultural emissions contribute about 25% to the total gross emissions, with livestock (15.5%) and rice (7%) as the principal emitters. (Table 2 in publication).
Implications for mitigation in the agriculture sector
Optimal mitigation scenarios would focus on areas with large emissions and low(er) uncertainties. These areas include agricultural hotspots (croplands, paddy rice and livestock) without very high levels of forest emissions, such as parts of India, southeastern Brazil, northern Argentina, southern parts of the Democratic Republic of Congo, Zambia, and Angola. Policy-makers can use this data to maximize mitigation potential while also taking into account socio-economic, technical, or ecosystem services considerations.
As pointed out in our paper, research has shown that agricultural intensification and the use of available non-forest land offer opportunities for agricultural mitigation of up to 1 PgCO2e. This value coincides with sectoral analyses for an aspirational mitigation for agriculture for 2030 that would keep agricultural emissions in line with the 2-degree warming limit.
Data limitations and next steps
Research and analysis continues on the following three issues.
1. This paper presents an assessment of gross emissions for the tropics and subtropics, excluding sinks (e.g. regrowth of cleared forests or burned areas, growth of standing forests, and soil carbon storage). Gross emissions assessments are useful for designing mitigation action and advancing mitigation implementation because they offer direct information on the emissions sources that may be changed through policies and measures to enhance and promote mitigation.
2. Net emissions, including sinks, are important since countries must report their mitigation commitments under the UNFCCC. In our study area, for the period 2000-2005, the major sink contribution relates to the growth of standing forests, since regrowth after deforestation and disturbances represent small contributions (except active afforestation in India and Viet Nam).
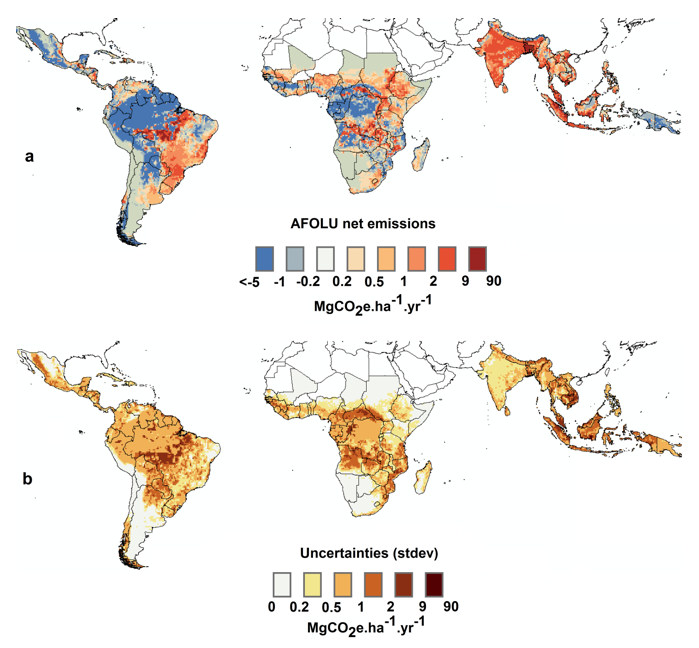
Source: Roman-Cuesta et al. (unpublished)
Preliminary - not yet published - research on the potential sink of standing forests in the tropics and subtropics (in Figure 3 above, unpublished) shows that hotspots of emissions and associated uncertainties would remain the same as identified under the gross emissions budget shown in Figure 1 since sinks do not compensate for emissions in these hotspots areas.
3. The temporal scale of our study 2000-2005 does not capture current trends, but hotspots of emissions are unlikely very dynamic at the spatial scale of our research (ca. 50km) since they respond to socio-economic and climatic contexts that do not change in a few years. Therefore, while our data represent a historic benchmark for monitoring progress on reducing emissions, it can also navigate current mitigation decisions and assist current review processes on national greenhouse gas emissions and NDCs commitments.
Where to access the data and the publication?
Roman-Cuesta RM, Rufino MC, Herold M, Butterbach-Bahl K, Rosenstock TS, Herrero M, Ogle S, Li C, Poulter B, Verchot L, Martius C, Stuiver J, de Bruin S. 2016. Hotspots of gross emissions from the land use sector: patterns, uncertainties, and leading emission sources for the period 2000–2005 in the tropics. Biogeosciences, 13:4253–4269. Open access.
Statistics on country AFOLU emissions means for 2000-2005 and the leading emission sources can be extracted from the Supplementary Material from the same link.
The spatially explicit data can be freely downloaded here.
Acknowledgments
This work was carried out as part of the low emissions agriculture flagship of CCAFS, and its Standard Assessment of Agricultural Mitigation Potential and Livelihoods (SAMPLES) initiative.
Authors of this article come from the following institutions:
- Center for International Forestry Research (CIFOR)
- Wageningen University and Research Centre (WUR)
- Karlsruhe Institute of Technology (KIT)
- World Agroforestry Centre (ICRAF)
- Commonwealth Scientific and Industrial Research Organisation (CSIRO)
- Colorado State University
- University of New Hampshire
- Montana State University
- Earth Institute Center for Environmental Sustainability
Funding also came from two European Union FP7 projects: GEOCarbon (283080) and Independent Monitoring of GHG Emissions-N° CLIMA.A.2/ETU/2014/0008. Partial funds came through CIFOR from the governments of Australia (Grant Agreement # 46167) and Norway (Grant Agreement #QZA-10/0468).
In the memory of Changsheng Li.
Rosa Maria Roman Cuesta is a scientist at the Laboratory of Geo-Information Science and Remote Sensing in the Wageningen University and Research Centre. She is also associated with CIFOR.
Julianna White, program manager for low emissions agriculture research at CCAFS, edited this blog.