Unique agriculture research atlas site shows Africa from every angle
 Cecilia Schubert, Communications Officer(CCAFS Flagship 4)
Get to know the farming systems of Africa through illustrative maps and briefs from the e-Atlas initiative.
Who hasn’t spent hours of their childhood browsing through huge atlases searching for cities with funny names, counting the countless islands in the Pacific Ocean or fantasized about the vast jungles of South America and Africa? Maps are a great teaching tool - both for kids and adults - that allow for anyone to explore and learn about vast land areas around the world.
Launched last year, as part of the e-Atlas project, the Atlas of African Agriculture Research & Development aims to provide insightful learning opportunities related to agriculture in Africa.
Through a series of briefs and colourful maps the atlas illustrates agricultural productivity, modelled climate impacts on food security, and progress on agriculture research and development. The site presents more than just crop information, as it features maps on Africa’s administrative boundaries, water availability and sources, access to local and international markets, as well as the status of hunger, early childhood and nutrition and health, and poverty on the continent.
The e-Atlas project has made the atlases and briefs freely available to the public, making sure many more get to know Africa from every angle.
The initiative has in addition published a print version of the Atlas of African Agriculture Research and Development, available for download via the International Food Policy Research Institute (IFPRI) site. The project is ongoing as the site will continue to feature updated spatial data, maps, information and tools, which have been put together by a community of development researchers and practitioners working in and for Africa.
Photo: What the e-Atlas site has to offer. Explore!
An immense mapping project, and the product of many partners, including IFPRI, Bill and Melinda Gates Foundation, CGIAR-CSI, Harvest Choice and the CGIAR Research Program on Climate Change, Agriculture and Food Security (CCAFS).
CCAFS Flagship leader and researcher at the International Livestock Research Institute (ILRI) Philip Thornton has so far contributed three briefs and accompanying maps that cover the topics Impacts of Climate Change on length of growing period, Rainfall and its variability and Livestock and mixed Crop-Livestock Systems, described further down.
Climate change puts Africa’s growing periods at risk
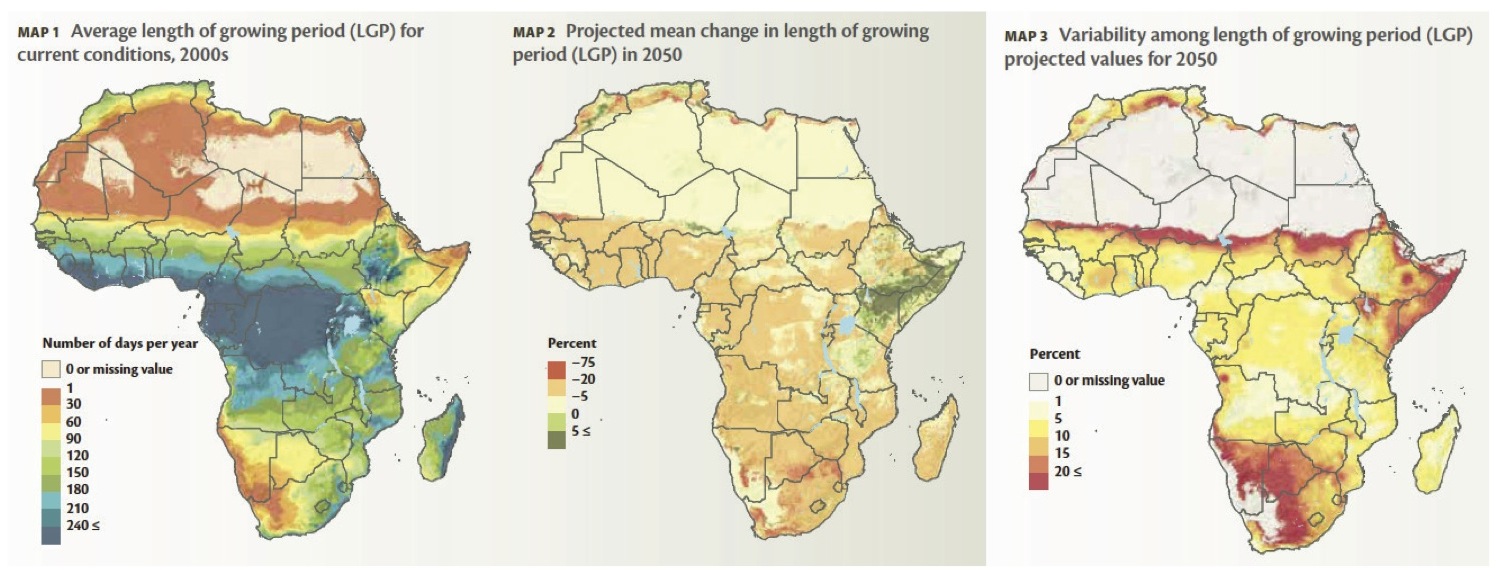
In the brief, ‘Impacts of Climate Change on Length of Growing Period', Philip Thornton shows how climate change, between now and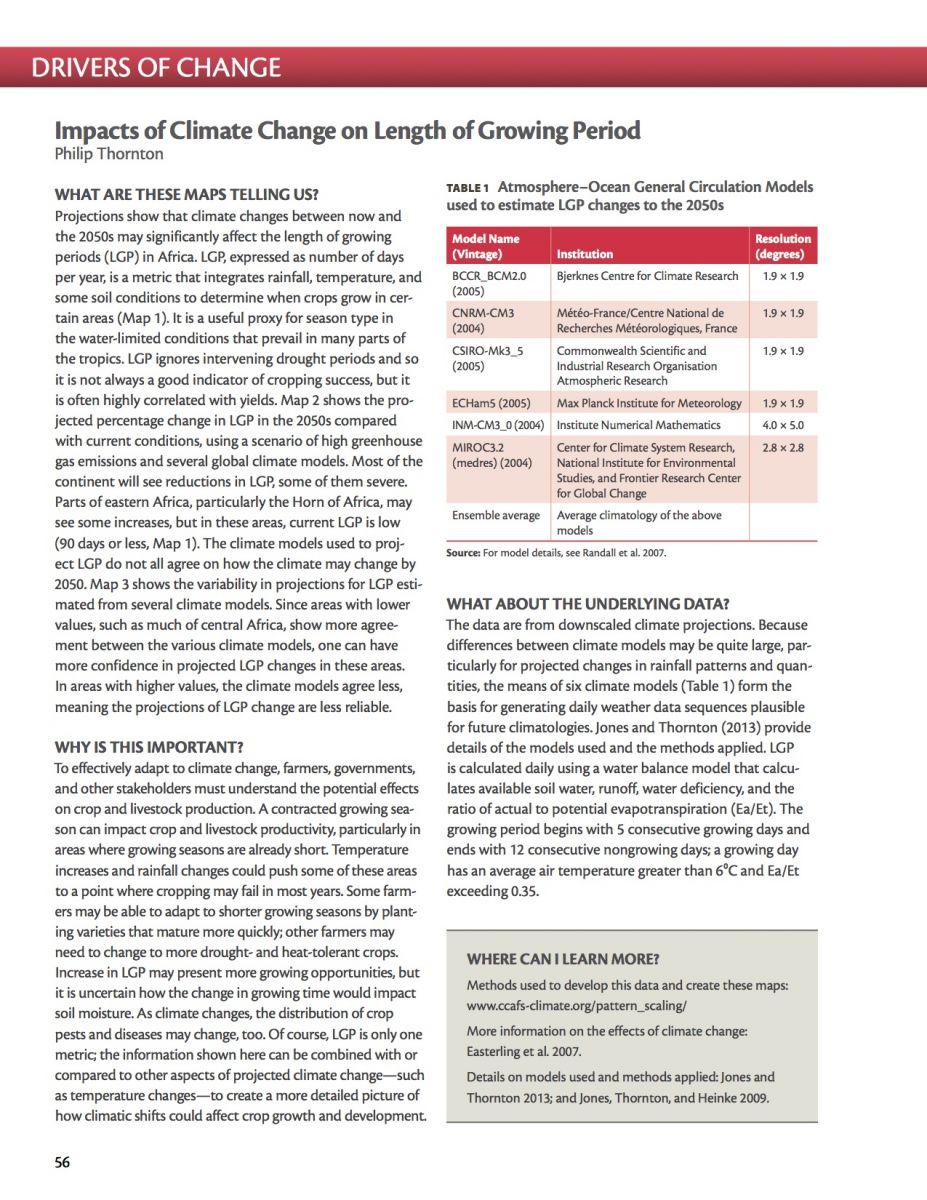 the 2050s, may significantly affect the length of growing periods (LGP) in Africa; in some areas very severely. The brief even states that "temperature increases and rainfall changes could push some of the areas to a point where cropping may fail in most years."
The length of growing periods, expressed as number of days per year, is a metric that integrates rainfall, temperature, and some soil conditions to determine when crops grow in certain areas and are many times correlated with yields.
In order for countries to appropriately adapt their agriculture and livestock production according to climatic impacts on growing periods, this kind of information and modeling excersises are crucial.
There are currently several adaptation opportunities available to smallholder farmers in Africa, that could assist with effectively managing changing growing periods. In some instances, in an area that will most likely experience a reduction in growing seasons, planting more fast-maturing crop varieties could prove to be a sustainable and viable option. In other instances, a change towards more drought- and heat-tolerant crops could be more appropriate.
Maps: Average length of growing periods, including LGP variability, for Africa (2000 & 2050) under climate change. From brief: Impacts of Climate Change on length of growing period. Click to enlarge.
Learn more, download the brief: Impacts of Climate Change on length of growing period
Extent of mixed crop-livestock systems
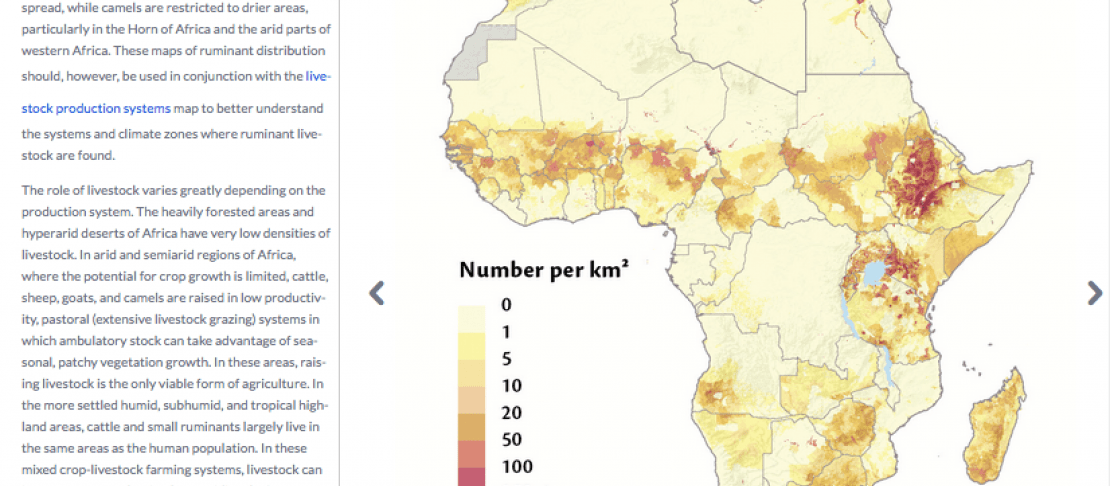
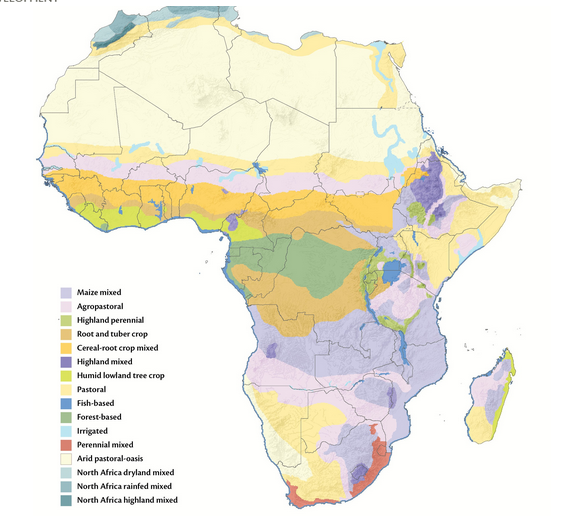
According to the brief, Livestock and mixed Crop-Livestock Systems, "livestock-producing agricultural systems cover 73% of Africa". Thus, many smallholder farmers in the continent care for animals, managing so called mixed crop-livestock systems. Most of these mixed-systems are found in western Africa, eastern Africa, and parts of southern Africa, and stretch across several climates, which also many times determine which type of farming is practiced. For example, in dryer rangeland areas it is more likely that farmers will manage livestock only, whereas in more humid and tropic areas, smallholders usually have more farm- and crop options.
As stated in the AgAtlas livestock brief, understanding the agriculture systems is important as crops and livestock are often 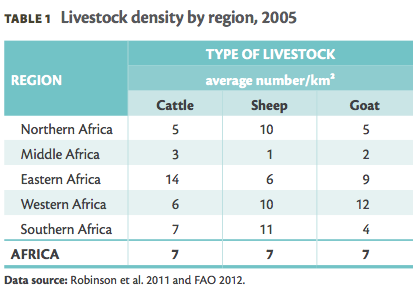 interdependent and influence farmer households and livelihoods in a number of ways. Detailed knowledge of crop and livestock systems and their distribution allows researchers to measure impacts on everything from the environment to livestock disease risk. For example viewing the livestock density by type and region helps researchers measure the level of environmental impact.
Graph and information from the brief: Livestock and mixed Crop-Livestock Systems.
Benefits from understanding Africa’s rainfall variability
Most smallholders on the continent manage their farming based on the rain they receive every season. Because rain-fed agriculture is the predominant system in Africa, crop growth is limited by water availability and dominated by rain variability. As explained in the brief, Rainfall and its variability, this will many times mean that crop production will experience great variability.
With the continent's economy largely based on agriculture production, the brief concludes, a better understanding of rainfall, and its variability will mean greater chances of predicting possible production changes, especially in drier rangelands areas. Adopting proven measures to better manage rain variability, such as water management, storing and drip-irrigation will also be key in improving agriculture production.
From the brief: To estimate the variability of annual rainfall, the weather generator MarkSim was used to simulate 1,000 years of daily rainfall data for the roughly 420,000 grid cells that make up Africa and the standard deviation of annual rainfall was calculated for each grid cell and converted to the coefficient of variation. MarkSim predicts rainy days and is able to simulate the variation in rainfall observed in both tropical and temperate regions. Download: Rainfall and its variability
Learn more about MarkSim: Weather generator for credible future climates
Another interesting map: Farming Systems of Africa. Click to get to the site and a larger map.
Related resource: Atlas of CCAFS sites
Cecilia Schubert works with communication for CCAFS Flagship 4: Policies and Institutions for Climate-Resilient Food Systems.
Subscribe to FP4 Quarterly Newsletter for updates related to Data and Tools, Future Scenarios, high-level policy engagement and knowledge-exchange and much more.
Want to learn more about the e-Atlas project? Contact: Kate Sebastian on ksebconsult[at]gmail.com