CSA Programming and Indicator Tool

Download the tool and the companion document
In the context of a collaboration with USAID Feed the Future, the CSA Programming and Indicator Tool has been designed to contribute to address both the need of good instruments for programming, and better metrics for tracking outcomes and impact, and to allow multiple development agencies and agricultural focused programs to share a common framework on how they are currently addressing climate-smart agriculture (CSA), and how they can make their future programming process more climate-smart.
What for?
The CSA Planning and Indicator Tool guides the user through a thoughtful and transparent process to:
- examine through the three dimensional lenses (productivity/income, adaptation and mitigation) to what extent its current intervention addresses each CSA pillars, or which might be the potential climate-smartness of a planned intervention;
- compare the scope and CSA intentionality among different project designs; and
- support the identification and selection of an appropriate set of indicators to measure and track CSA outcomes.
By going through this CSA programming process, donors and implementers can:
- provide visibility to CSA impact areas not originally targeted or focused by the intervention;
- strengthen the planning phase of interventions to ensure that all potential CSA related outcomes (beyond productivity/income pillar) are properly included in the monitoring and evaluation (M&E) design; and
- increase awareness on how to ‘make’ their future interventions' planning process climate-smart.
Supported by a database of over 378 indicators with CSA-related indicators gathered from several international development agencies/ institutions (FAO, DFID, GIZ, IFAD-ASAP, World Bank, USAID and CCAFS), this tool will facilitate the delivery of not only productivity outcomes, but also positively tracking adaptation and mitigation impacts.
How: the process
The tool consists of three steps:
Step 1: Definition of scope and intentionality of desired outcomes
The user is invited to respond to specific questions related to the three CSA pillars. A traffic light system allows to specify the degree of intentionality desired (red: not at all, amber: indirectly and green: directly). The main objective is to enable users to more systematically check for potential co-benefits and/or unintended outcomes (in more than one pillar), and thus properly identify appropriate indicators and metrics for its M&E.

Step 2: Selection of intended scale of action (Household/farm, subnational, national) and indicator's type based on the current stage of the intervention
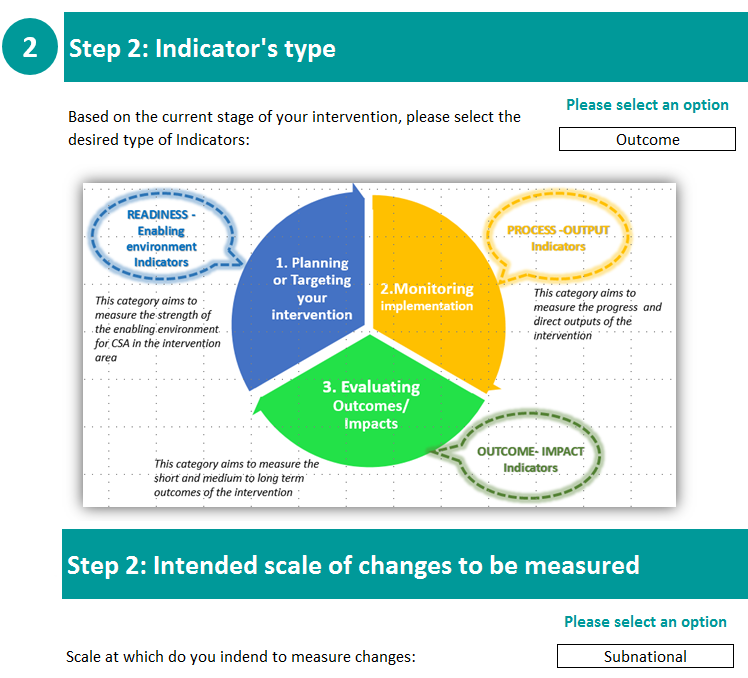
Step 3a: Results summary. This step leads to a proposed set of relevant indicators that can be used and their closeness of fit to inform the design and M&E plan of future interventions.
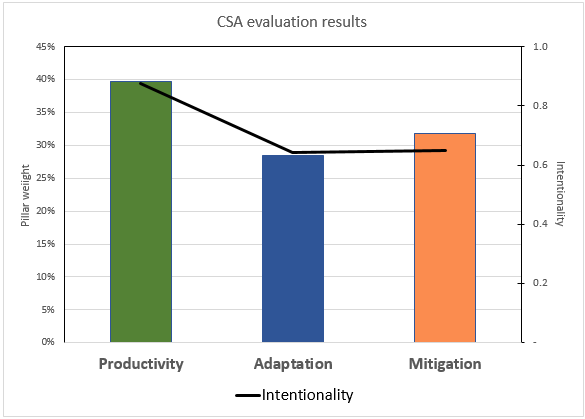
Step 3b: Visualization. This step includes the intervention's evaluation through CSA lens and degree of intentionality.
This step-by-step tool should serve as a guide tailored to the needs and capacity of each agency/practitioner.
Disclaimer
This CSA programming and Indicator Tool is an evolving prototype product until a critical mass of users has trialed the instrument and provided feedback on how it can be improved. Updates will be published in this website as the Tool evolves and new versions are developed.
Download the tool and the companion document
Should you use it, please share your comments with us at o.bonilla@cgiar.org.
The database and methodology
Over 378 indicators from DfID, World Bank, CCAFS, USAID, IFAD, GIZ and FAO were compiled into a database and revisited through a “CSA lens” to form the basis for this tool. Beyond identifying their relevance to the three pillars, the following characteristics were also included in the classification exercise:
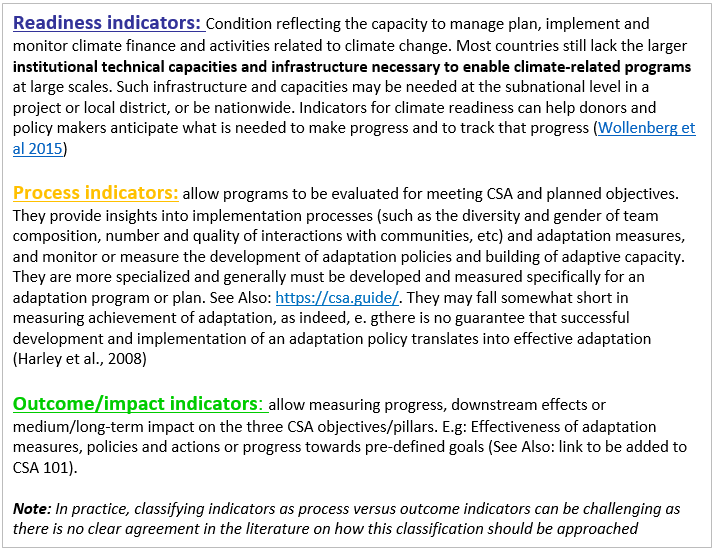
Indicator type (Readiness/enabling environment; Process/output; Outcome/impacts) and related topic/area:
- CSA type of intervention (Technologies and practices; Services; Tools; Incentive Mechanisms/financial; Empowerment, Capacity building and Planning), and
- Scale at which the changes are intended to be measured
i. Household/ Farm ii. Subnational (including the regional, landscape, value chains, institutional scales) iii. National (policy, institutional and programmatic scales) |
Specific relevance rating was also (subjectively) assessed to help users identify most appropriate indicators from a long list.
Indicators relating to income and poverty were classed under productivity; indicators that did not directly relate to a CSA pillar, such as health and nutrition, were not included. Some indicators were edited to be more in line with CSA outcomes and 85 “new” indicators were created.
Key findings
- The emphasis on quantitative indicators is clear.
- Significant lack of indicators relating to mitigation outcomes; most common indicators are related to productivity.
- Among the indicators related to the productivity pillar there is an emphasis on yields, income and livelihood security, with an evident gap on indicators related to: support policy and legal framework to improve food security and food availability and access.
- Adaptation indicators are largely geared towards risk management, technologies, information and enabling environment.
- There are very few indicators specifically address seed varieties, crop insurance and financial indicators geared towards the adoption of CSA technologies and practices.
- Generally, indicators lacked the ability to show a change over time, or to measure specific changes in low/lean season (increase on-farm production and/or livelihoods) and.
- Perception indicators were missing.
Sources
CCAFS - Readiness:
Wollenberg E, Zurek M, De Pinto A. 2015. Climate readiness indicators for agriculture. CCAFS Info Note. Copenhagen, Denmark: CGIAR Research Program on Climate Change, Agriculture and Food Security (CCAFS).
CCAFS - Resilience:
Hills T, Pramova E, Neufeldt H, Ericksen P, Thornton P, Noble A, Weight E, Campbell B, McCartney M. 2015. A Monitoring Instrument for Resilience. CCAFS Working Paper no. 96. Copenhagen, Denmark: CGIAR Research Program on Climate Change, Agriculture and Food Security (CCAFS).
DFID:
Climate Investment Funds Monitoring and Reporting toolkit
Adaptation Fund:
Methodologies for reporting Adaptation Fund core impact indicators
International Climate Fund:
Chars Livelihoods Programme Logframe (excel sheet)
FAO:
Production. Production strategic indicators (FAOSTAT) : Production and productivity– Crops net per capita production index number (2004-2006 = 100), including fiber; Livestock net per capita production index number, including wool (2004-2006 = 100); Fish production per capita (tonne/cap) (both capture and aquaculture); Roundwood production per capita (m3/cap); Agriculture value added per worker (constant 2,000 USD); Total factor productivity (TFP) growth in agriculture has remained stable or increased, since the last reporting period (source of all above: FAOSTAT); Area with improved agricultural productivity and crop suitability in agriculture (Source: Global Agro-Ecological Zones– GAEZ)
Resilience. Corporate indicators on resilience (information collected through a questionnaire)
GIZ:
Repository of Adaptation Indicators
Climate change adaptation indicators list .
IFAD-ASAP:
Adaptation for Smallholder Agriculture Programme (ASAP) results and indicator framework
USAID: FTF:
Indicator handbook and definitions
USAID Standard Foreign Assistance Indicators (under 4.8 : Environment; Capacity Building, Gender, and Science (STIR) indicators)
World Bank
Acknowledgments
In addition to CCAFS Donors, the U.S. Agency for International Development (USAID) supported the publication of the Tool on this page. The opinions expressed herein are those of the author(s) and do not necessarily reflect the views of USAID.