Evaluating the transparency, accuracy, completeness, comparability and consistency of GHG inventories in national communications to the UNFCCC

 Kyle Dittmer
Countries party to the United Nations Framework Convention on Climate Change (UNFCCC) currently provide a national inventory of anthropogenic greenhouse gas (GHG) emissions and discuss mitigation actions in their national communications (NC) reports. However, official country data for agriculture has been lacking, predominantly from low- and middle-income countries (LMICs), making it difficult to compare countries and identify mitigation priorities.
The CGIAR Research Program on Climate Change, Agriculture and Food Security (CCAFS) Low Emissions Development (LED) Flagship reviewed and compiled official UNFCCC country reported GHG data and inventory methodology within the most recent NC reports with a focus on what they provide in terms of global GHG accounting:
- Where are net agricultural emissions the greatest?
- Where are agricultural emissions per capita the greatest?
- What methodological assumptions underly inconsistencies in the reporting and their significance?
- How do inventory results differ based on global warming potential (GWP) selection?
The database reflects national GHG inventory submissions based on data from 1994 through 2019 for 194 countries.
What are the country reporting requirements set by the unfccc?
Most LMICs are considered Non-Annex I countries, and are required to submit their first NC within three years of joining the Convention, and every four years thereafter (17/CP.8), provided that funding for the preparation of reports is available. Non-Annex I countries also submit their biennial update reports every two years beginning in 2014. Non-Annex I countries should use the Revised 1996 Intergovernmental Panel on Climate Change (IPCC) Guidelines for National Greenhouse Gas Inventories (Revised 1996 IPCC Guidelines) for estimating and reporting their carbon dioxide (CO2), methane (CH4), and nitrous oxide (N2O) emissions at a minimum, and should use the global warming potential (GWP) determined in the IPCC Second Assessment Report (SAR) (CH4 = 21; N2O = 310) based on a 100-year time scale if aggregating emissions in CO2 equivalence (CO2e). For Non-Annex I countries, CCAFS LED collected this data from countries’ GHG inventory tables in countries most recent NC or biennial update report.
High-income countries (Annex I countries) are required to submit their NC to the secretariat every four years (decision 2/CP.17), but the requirements are much higher. They must:
- submit annual inventories in common reporting format tables and national inventory reports with 1990 as the base year for the estimation and reporting of inventories (decision 24/CP.19);
- cover emissions and removals of direct GHGs (CO2, CH4, N2O, perfluorocarbons, hydrofluorocarbons, sulphur hexafluoride and nitrogen trifluoride) from five sectors (energy; industrial processes and product use; agriculture; land use, land-use change and forestry (LULUCF); and waste);
- use the methodologies provided in the 2006 IPCC Guidelines for National Greenhouse Gas inventories (2006 IPCC Guidelines); and
- use GWP from the IPCC Fourth Assessment Report (CH4 = 25; N2O = 298) prescribed in decision 24/CP.19.
All Annex I GHG data was extracted from common reporting format tables as they contained the most recent inventory.
In the LULUCF sector, key differences exist between reporting with Revised 1996 or 2006 Guidelines. The 1996 IPCC Guidelines for GHG accounting separates agriculture and LULUCF. The 2006 IPCC guidelines (required to be used after 2015 by Annex I countries) linked agriculture and LULUCF in one category known as Agriculture, Forestry and Other Land Use (AFOLU). However, in terms of reporting with common reporting format tables, Annex I national inventories will continue to have two separate chapters for Agriculture and LULUCF beyond 2015 (decision 24/CP.19). The difference between agriculture and LULUCF is mainly that emissions or removals and carbon storage are possible in LULUCF, whereas there are only emissions in agriculture. Hence, soil carbon is not considered within the agriculture sector but under Cropland and Grassland in LULUCF.
UNFCCC agricultural emissions and agricultural emissions per capita results
China, U.S.A. and Brazil reported the highest total agricultural non-CO2 emissions among all countries, respectively, accounting for 33% of total global agricultural emissions. The top ten emitting countries accounted for 53% of global emissions (Table 1, Fig. 1). Of the top ten agricultural emitters, two were Annex I countries (U.S.A., Russia) and the remaining eight were Non-Annex I countries. Seven countries, six of which were Non-Annex I, did not report any agricultural emissions.
Table 1. Ranking of top 10 from highest to lowest agricultural emitters from the UNFCCC inventory by (i) total emissions, (ii) percentage of total gross emissions, and (iii) emissions per capita based in 2018 using GWPs from AR5. U.S.A. = United States of America. U.R. = United Republic.
Agricultural emissions (megatons per year) | Agricultural emissions as percentage of national emissions | Emissions per capita (metric ton) | |||
|---|---|---|---|---|---|
Country | CO2e | Country | % | Country | CO2e |
China | 932.9 | Vanuatu | 87.4 | New Zealand | 8.7 |
U.S.A. | 611.2 | Chad | 83.3 | Uruguay | 8.1 |
Brazil | 506.9 | Rwanda | 82.7 | Mongolia | 6.3 |
India | 493.7 | Burkina Faso | 81.9 | Paraguay | 4.6 |
Pakistan | 173.5 | Guinea | 80.6 | Ireland | 4.4 |
Tanzania | 172.5 | Uruguay | 74.9 | Guinea | 3.4 |
Indonesia | 122.3 | Cameroon | 73.6 | Namibia | 3.4 |
Argentina | 116.1 | Bhutan | 66.2 | U.R. of Tanzania | 3.1 |
Russia | 111.1 | Mauritania | 65.9 | Mali | 3.0 |
Mexico | 101.6 | Sudan | 64.8 | Australia | 2.9 |
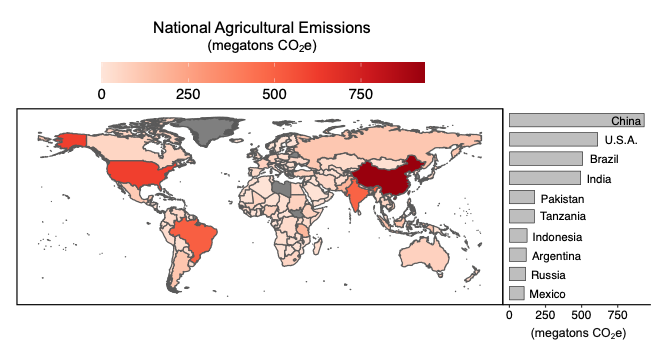
Figure 1. Annual national agricultural emissions converted to CO2e using GWPs from IPCC AR5. Grey countries = no NC or data.
On average, agriculture contributed 19% of countries’ gross national GHG emissions. The contribution ranged from 0 to 87% among countries (Table 1, Fig. 2). The average for Non-Annex I countries was 21%, and 12% for Annex I countries. Seventeen countries, all Non-Annex I, reported more than 50% of their national emissions from agriculture.
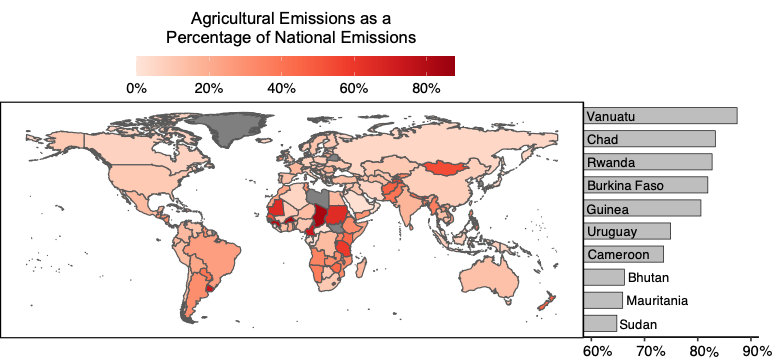
Figure 2. Annual national agricultural emissions as a percentage of national emissions converted to CO2e using GWPs from IPCC AR5. Grey countries = no NC or data.
The top 10 agricultural emissions per capita consisted of three Annex I countries (New Zealand, Ireland and Australia) using GWPs from AR5 (Table 1, Fig. 3) and AR4. Two Annex I countries were in the top 10 agricultural emissions per capita using AR2 GWPs. Populations in Non-Annex I countries, which already struggle with food security, are rapidly increasing and intensifying agriculture, leading to higher emissions (Smith et al. 2007).
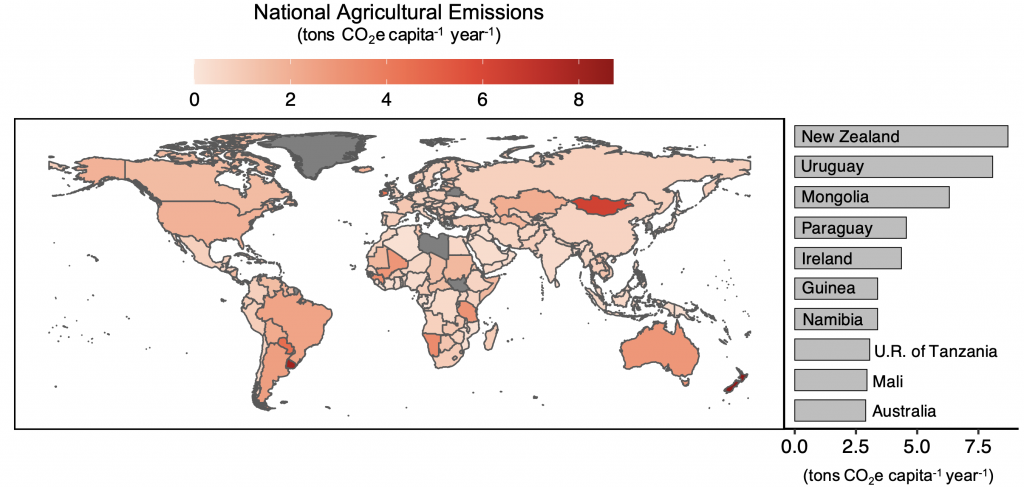
Figure 3. Annual national agricultural emissions per capita converted to CO2e using GWPs from IPCC AR5. Grey countries = no NC or data.
UNFCCC Inventory methodology results
More than half of the countries used the IPCC 2006 guidelines (Table 2), including 72 non-Annex I countries and 41 Annex I countries (two Annex I countries did not report what IPCC Guidance was used). Fifty-five Non-Annex I countries used the Revised 1996 IPCC guidelines. Twenty-two Non-Annex I countries used a combination of 2006 and Revised 1996 guidelines. Three Non-Annex I and two Annex I countries did not specify the guidelines used. Most Non-Annex I countries used the GWP recommended in AR2 (82 of 154). Twenty-four Non-Annex I countries used GWP from AR4 and 13 Non-Annex I countries used GWP from AR5. All Annex I countries used AR4 GWPs, though two countries did not specify the GWPs used.
Table 2. Count of Non-Annex I and Annex I countries’ IPCC National GHG Guidance Report and Assessment Reports used to compile their respective GHG inventories.
IPCC National Greenhouse Gas Inventory Guidance Report | IPCC Assessment Report | |||||
|---|---|---|---|---|---|---|
AR2 | AR4 | AR5 | NS | NA | Total | |
Non-Annex I Countries | ||||||
2006 IPCC Guidelines | 39 | 15 | 8 | 10 | 0 | 72 |
Revised 1996 IPCC Guidelines | 27 | 7 | 1 | 20 | 0 | 55 |
Revised 1996 IPCC Guidelines; 2006 IPCC Guidelines | 14 | 2 | 3 | 3 | 0 | 22 |
Not Specified (NS) | 2 | 0 | 1 | 0 | 0 | 3 |
Not Applicable (NA; NC does not exist) | 0 | 0 | 0 | 0 | 2 | 2 |
Total | 82 | 24 | 13 | 33 | 2 | 154 |
Annex I Countries | ||||||
2006 IPCC Guidelines | 0 | 41 | 0 | 2 | 0 | 43 |
Revised 1996 IPCC Guidelines | 0 | 0 | 0 | 0 | 0 | 0 |
Revised 1996 IPCC Guidelines; 2006 IPCC Guidelines | 0 | 0 | 0 | 0 | 0 | 0 |
Not Specified (NS) | 0 | 2 | 0 | 0 | 0 | 0 |
Not Applicable (NA; NC does not exist) | 0 | 0 | 0 | 0 | 0 | 0 |
Total | 0 | 43 | 0 | 0 | 0 | 43 |
With respect to land-use GHG reporting, 57 Non-Annex I countries reported emissions using AFOLU formatting and 115 countries separated Agriculture and LULUCF. Although 2006 IPCC Guidelines suggest the use of AFOLU reporting, all Annex I countries reported using LULUCF, consistent with Decision 24/CP.19. For agricultural per capita emissions using SAR GWPs, the top 10 emitters consisted of eight Non-Annex I and two Annex I countries. However, using AR4 GWPs for agricultural per capita emissions, the top 10 emitters consisted of three Annex I countries and seven Non-Annex I countries. Although per capita emissions did not significantly differ based on the GWP used relative to AR5 GWPs (p = 0.39 for AR5 v. AR2 GWPs; p = 0.85 for AR5 v. AR4 GWPs), these results highlight the importance of a uniform methodology to accurately rank and prioritize GHG hotspots and mitigation measures.
Methodology
CCAFS LED compiled national CO2, CH4, N2O emissions for
- net and gross total emissions,
- agricultural non-CO2 emissions,
- net AFOLU or LULUCF emissions, and
- net cropland and grassland emissions from the most recent NC report for Non-Annex I and Annex I countries to the UNFCCC.
Differences in GWP standards and reporting formats and quality were noted. Emissions were adjusted to be comparable using GWPs from the IPCC Fifth Assessment Report (AR5, 2013; CH4 = 28, N2O = 265). For countries that reported agricultural gases individually, we calculated CO2e using the AR5 GWPs. For countries that only reported emissions in CO2e without identifying the GWP used or did not disaggregate GHGs, we used the reported CO2e value. We compared agricultural emissions and emissions per capita using AR5, IPCC SAR and IPCC Fourth Assessment Report (AR4) GWPs with t-tests (R Foundation for Statistical Computing, Vienna, Austria; RStudio Team, 2015) to determine if emissions significantly differed across countries based on GWP selection. Each country’s agricultural emissions (CH4 and N2O only) were calculated as (i) national total, (ii) percentage of total gross emissions and as (iii) emissions per capita. Country population data for 2018 was acquired from FAOSTAT (2021).
Robust methods for climate change mitigation
The quality of national GHG inventories is contingent upon the integrity of the methodologies used to calculate GHG inventories in addition to the standardized procedures for data collection. To this end, the IPCC’s guidelines for national GHG inventories are paramount to shaping climate policy. However, improving the transparency and accuracy, as well as reliability, of inventories requires urgent attention to achieve climate change mitigation goals within the next three decades.