Update: Mapping Hotspots of Climate Change and Food Insecurity
Last month we launched a report showing global hotspots to climate induced food-insecurity, garnering significant media attention. Several weeks later, the authors noticed two errors in the calculations, and so we immediately took the report offline for corrections. We have issued an erratum that outlines the errors in the first version as well as in the press release. The errors are related to calcluation of population numbers, in one case the number of people at risk is underestimated, while in the other case the number of people most at risk is overestimated.
- The press release stated that "there are 56 million food-insecure and crop-dependent people in parts of West Africa, India and China who live in areas where, by the mid-2050s, maximum daily temperatures during the growing season could exceed 30 degrees Celsius (86 degrees Fahrenheit)." The accurate number is 170.5 million.
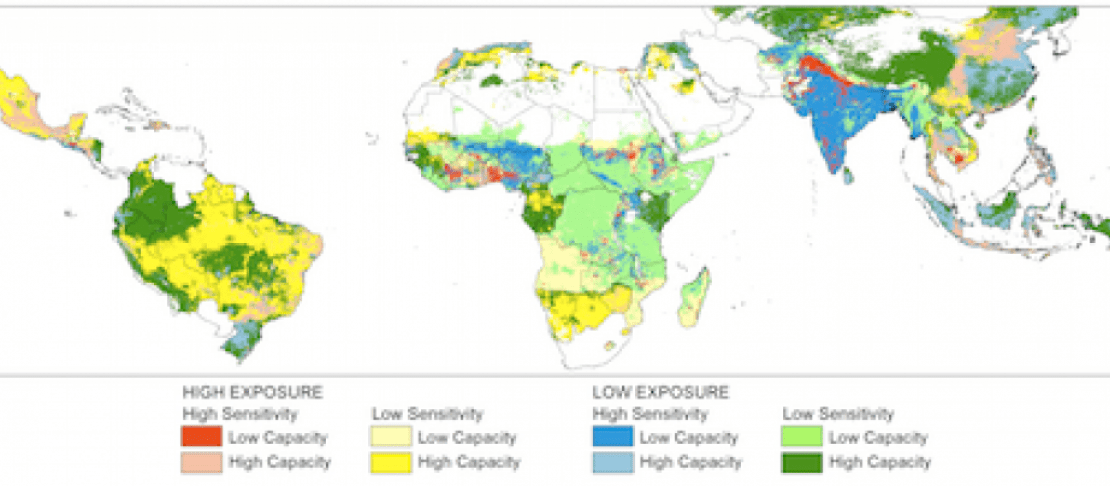
Why did this happen? The researchers miscalculated the population numbers (in this case the number of people affected) by a factor of about three. Therefore, the population number in the maps 4.4 through 4.12 are underestimated as well. Map 4.4 (above) was further modified to correct High and Low exposure categories (which had been reversed)
What is the significance of this? The new numbers tell us basically the same story as our previous calculations, only that more, not fewer, people are likely to be affected by hunger and more extreme climates.
- The press release stated that "there are 369 million food-insecure people living in agriculture-intensive areas that are highly exposed to a potential five percent decrease in the length of the growing period." The accurate number is 265.7 million. However, the number in the two highest categories of vulnerability (HHL and HHH), goes up from around 607 million in the previous calculations to nearly 1 billion (999.8 million) in the current calculations.
Why did this happen? The researchers mistakenly transposed the "high" and "low" exposure categories in the 5% map (4.4), which actually results in a lower number of people being most at risk than was stated in the press release.
What is the significance of this? Our revised map shows the same basic message as our previous map, that large portions of India, West Africa, and China are predicted to be hotspots of both climate change and food insecurity.
Erratum: The corrected figures are now available for download (PDF).
Corrections to Press Release: Download the corrected press release in multiple languages at our Press Room.
The final revised report is available now. Click to access
We welcome your comments and questions below, and we appreciate your patience as we correct and finalize the report.