Big Facts: bringing together science, art and pie charts
The communication of science is wrought with challenges.
How do you simplify complex science so that it is understandable by many, rather than a few, without reducing it to meaningless nothings? How do you communicate uncertainty within science without undermining the impact of that science? How do you communicate consistently when science is constantly progressing and open to re-evaluation?
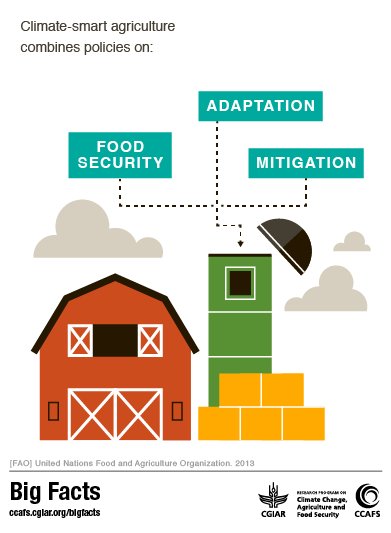 When bringing three areas of science together, as is the case for the nexus of science where climate change, agriculture, and food security meet, such issues only amplify.
Meanwhile, at the other receiving end of our communications, people are struggling to sort between conflicting claims from unknown sources, and to locate the most up-to-date and reliable resources in the sea of journal papers, reports, advocacy materials and other sources that are available.
Filling the knowledge gap
Big Facts is a project, led by the CGIAR Research Program on Climate Change, Agriculture and Food Security (CCAFS) that aims to put some of these issues to bed, at least for the time being.
'Feedback from our partners showed that there was a gap - people were looking for a site that brought together agriculture and climate, adaptation and mitigation, biophysical and socioeconomic data. As a science organization, our goal was to provide rigorous and impartial information that users can trust' said Sonja Vermeulen, Head of Research at CCAFS, who led the project with research assistance from us, Simon Bager and Lucy Holt at the University of Copenhagen.
For a topic this important, there is obviously a lot of information available in reports, journals, and data sets. During the course of the project the researchers plowed through as much of the research available as possible to find the most scientifically accurate, up-to-date and useful pieces of information on how climate change will impact on agriculture and food security and vice versa. Naturally, is impossible to capture every detail, and to deliver a useful and user-friendly product, some findings had to be cut. However, we have strived to capture the essence of the issues and challenges in all of the areas; from food security to adaptation to policy finance.
Synthesizing and simplifying science
Big Facts is an open-access website, available to all. It is carefully curated, identifying and covering all the big issues. It only references credible sources and facts where there is evidence to back them up. Unlike other reports or websites, which might reference peer-reviewed articles - the Big Facts website is itself peer reviewed, adding a critical feedback loop and quality check.
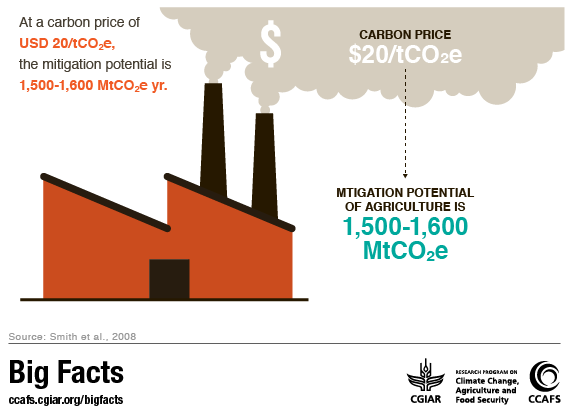
While the website inevitably simplifies facts to make them more digestible for a broader audience while retaining their scientific validity, it also provides links to more detailed information and the original scientific sources. The aim is to encourage readers to dig deeper and explore the science for themselves, while also sharing the science through simplified infographics and facts sheets.
'We put a lot of emphasis on fact checking and ensuring that we were not misrepresenting the science or over-claiming the certainty in the statements given. In some cases this reduced us to quite a generic statement on a topic but that is a fair picture of the current science in some complex areas' said Vermeulen.
Big Fact 2014: bigger and better
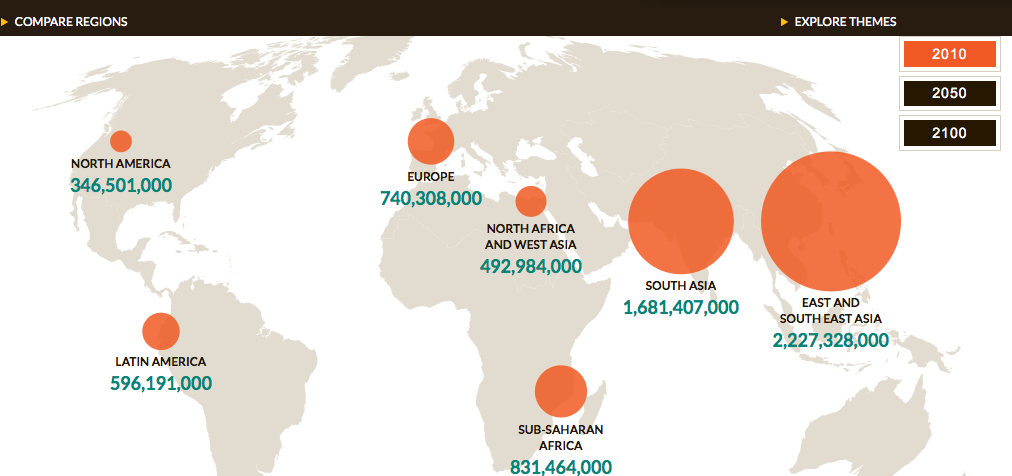
The Big Facts project was first launched in 2012, but is being re-launched today after a nine-month period of research and development. The new site covers a much wider range of topics, and provides region-specific as well as global level information. Dynamic charts allow users to compare indicators such as population growth, emissions, undernourishment, or food waste, either by region or over time.
Regional comparison: Population
Art meets science
The new Big Facts website has been developed in partnership with Column Five, a leading infographic development agency based in California. By working with artists outside of the scientific sphere, we hoped to communicate these important facts in different and engaging ways - while still remaining true to the science.
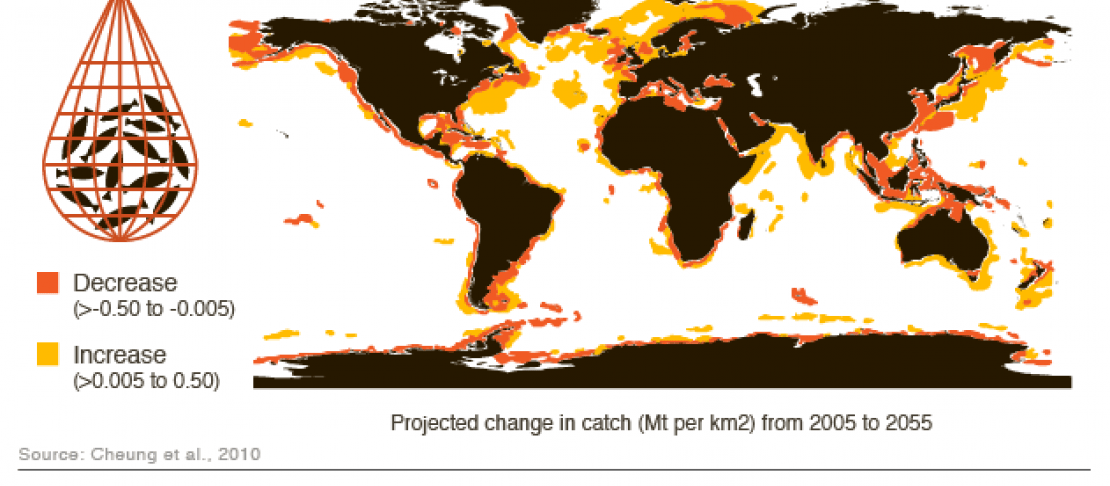
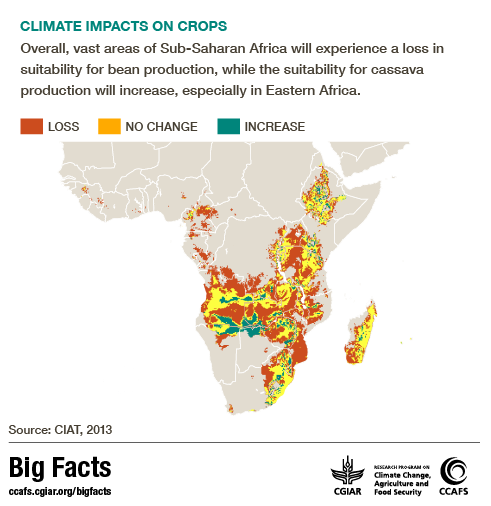
The new Big Facts website offers access to 114 infographics which we encourage scientists, program and policy makers, journalists, students - anyone and everyone - to download and insert into their presentations and reports or share through their social media networks. It also offers 33 fact sheets, summarizing the Big Facts related to some of the most pertinent issues, which are available to download.
A work in progress
Like the science that underpins it, the Big Facts website is a work-in-progress. It will undergo a review after the release of the next IPCC reports later this year, and will be updated as new reports are released. We also invite all users to send us their feedback, to let us know what you think and how Big Facts could be more useful for you.
This allows audiences of different knowledge levels to engage - whether you are a businessman doing market research, a high school student doing a class project, or a scientist doing an academic review - the Big Facts website aims to deliver the level of detail you are seeking, in a format that is relevant to you.
Lucy Holt and Simon Bager both work as Assistants at the CCAFS Coordinating Unit

